
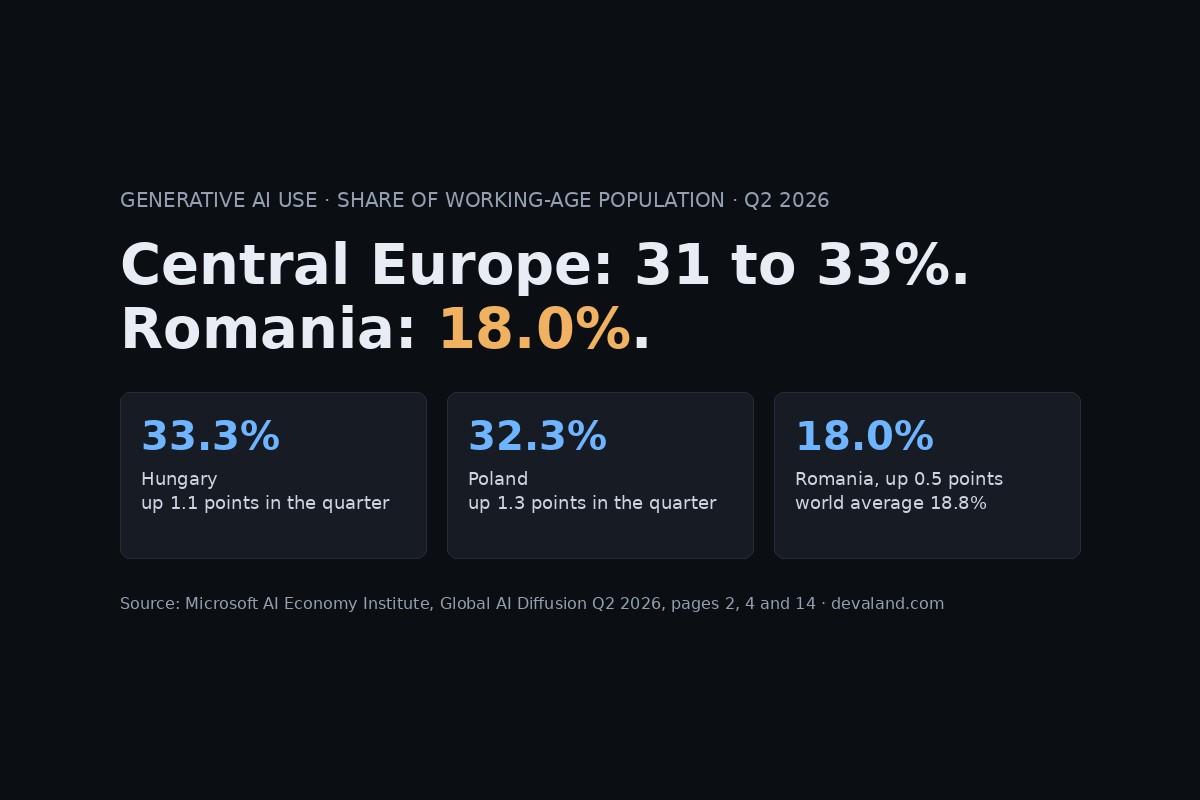
Quick answer: in Microsoft's Global AI Diffusion report for Q2 2026, 18.0% of Romania's working-age population used a generative AI product, below the world figure of 18.8%. Hungary is at 33.3%, Poland at 32.3% and Czechia at 31.2%. Romania grew 0.5 percentage points in the quarter, about half the global pace. The number measures use, not skill, and says nothing about a country's software industry.
Why we checked the source
On 1 October 2026 the Romanian press carried a line from a Microsoft announcement: only 18% of Romanians of working age use generative AI. We teach people to verify what an AI system tells them against the source, so we applied the same rule to a press release. We opened the report and read the tables.
The figures, from the report's own tables
| Economy | Q1 2026 | Q2 2026 | Change |
|---|---|---|---|
| Hungary | 32.2% | 33.3% | 1.1 points |
| Poland | 31.0% | 32.3% | 1.3 points |
| Germany | 31.1% | 32.3% | 1.2 points |
| Czechia | 30.1% | 31.2% | 1.1 points |
| Serbia | 24.1% | 25.3% | 1.2 points |
| Greece | 20.8% | 21.5% | 0.7 points |
| Moldova | 18.5% | 19.1% | 0.6 points |
| Romania | 17.5% | 18.0% | 0.5 points |
Worldwide, the report gives 18.8% for June 2026, about one point up on the previous quarter. The United Arab Emirates (73.3%) and Singapore (64.3%) lead. The announcement quoted in the press places Romania 65th of 147 economies. We verified the values in the tables, not the count of places.
What the number measures
The report describes its own measure: an estimate of the share of the working-age population that has used a generative AI product in the period. Three things follow.
- It is Microsoft's estimate, built with the method the report describes. It is not a census and not an official statistic.
- It measures use, not skill. Someone who opened a chat assistant once and someone who works with one every day count the same.
- The report says itself that the measure does not see indirect use: applications that call a model through an API, and models an organisation runs on its own infrastructure.
What it does not tell you
It does not describe a country's engineers. A consumer adoption share and the capacity to build software are different things, and the report measures only the first. If you are choosing a supplier in Central or Eastern Europe, this table is not evidence for or against any of them. Ask for something you can open and run instead.
What it means inside a company
The average says nothing about your own team. It does suggest two practical points, neither of them a promise of a result.
- If nobody on your team uses these tools yet, you are in the majority in most of the world, not behind it.
- The gap does not close with a licence. It closes when people know what to use the tool for, and what never to put into it.
Four steps that cost nothing: pick one repetitive task and try it for a week; write a one-page rule on what never goes into a public tool and who answers for the output; check every answer against its source; and time the task before and after. That last number is the only one that matters to you, and no report can supply it.
Sources
- Microsoft AI Economy Institute, Global AI Diffusion: Q2 2026 Trends and Insights, September 2026: executive summary on page 2, ranking on page 4, table on page 14.
- start-up.ro, 1 October 2026, the article that carried the announcement.
Read on 2 October 2026. If you find a difference from the source, write to us and we will correct the article.